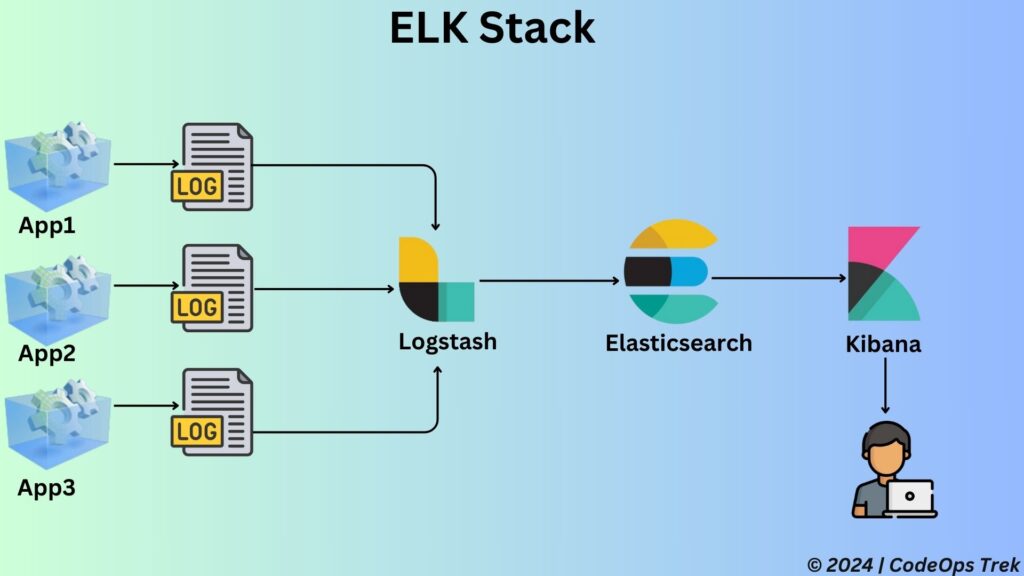
In today’s digital landscape, efficient log management and analysis are vital for maintaining high-performing applications. The ELK Stack—comprising Elasticsearch, Logstash, and Kibana—is a powerful open-source toolset designed to enhance log management and provide actionable insights. In this guide, we’ll explore each component of the ELK Stack, explain how they work together, and illustrate their application with a practical example from an e-commerce application.
Table of Contents
The ELK Stack is a trio of open-source tools that work together to offer a complete solution for managing log data. The acronym ELK stands for:
- Elasticsearch: A distributed search and analytics engine.
- Logstash: A data processing pipeline that ingests, transforms, and sends data.
- Kibana: A visualization tool that connects to Elasticsearch for querying and displaying data.
These tools combine to provide a robust framework for collecting, storing, searching, and visualizing logs, making it easier to gain insights and troubleshoot issues.
Elasticsearch serves as the backbone of the ELK Stack. It is a distributed search and analytics engine designed for high-speed data retrieval and scalability. Here’s an overview of its key features:
- Real-Time Search: Elasticsearch offers real-time search capabilities, allowing for rapid querying and analysis of data.
- Scalability: It supports horizontal scaling, meaning you can expand your cluster by adding more nodes to handle increased data volumes.
- Schema-Free: Elasticsearch can index and search data without a predefined schema, offering flexibility for diverse data types.
Elasticsearch is ideal for applications that require fast search and analytics, making it the central repository where logs are stored and indexed for efficient retrieval.
Logstash functions as a data processing pipeline that collects, transforms, and sends data to Elasticsearch. Here’s how Logstash operates:
- Data Ingestion: Logstash collects logs from various sources, such as servers, databases, and applications. It supports multiple input plugins for different data sources.
- Data Transformation: Before sending data to Elasticsearch, Logstash processes it. This includes parsing logs, adding metadata, and filtering unnecessary information.
- Data Output: Logstash sends the processed data to Elasticsearch for indexing and storage.
With its extensive plugin ecosystem, Logstash is highly configurable and can handle diverse data formats and sources, ensuring that your logs are processed consistently.
Kibana is the visualization layer of the ELK Stack. It provides a user-friendly interface for querying and visualizing data stored in Elasticsearch. Key features of Kibana include:
- Interactive Dashboards: Kibana enables the creation of customizable dashboards to visualize data through charts, graphs, and maps.
- Search and Querying: It offers powerful search capabilities, allowing users to explore data and perform detailed queries.
- Data Exploration: Kibana provides tools for analyzing data trends and patterns, making it easier to understand complex datasets.
Kibana transforms raw log data into meaningful visualizations, helping users to monitor application performance and identify issues effectively.
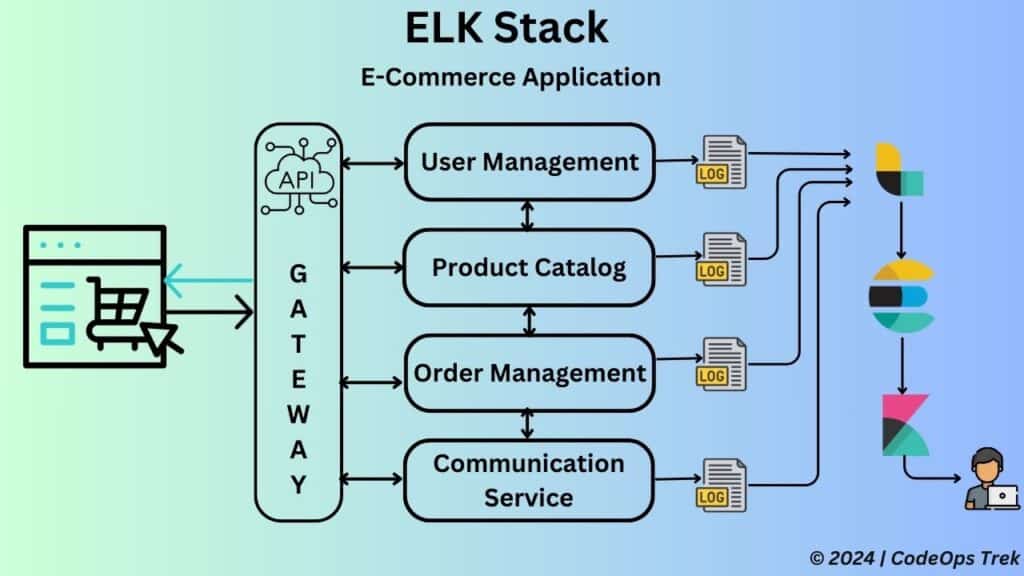
To illustrate the ELK Stack in action, let’s consider an example involving an e-commerce application with the following microservices:

- API Gateway: Routes requests to the appropriate services.
- User Management Service: Handles user profiles and authentication.
- Product Catalog Service: Manages product data and inventory.
- Order Management Service: Processes and tracks orders.
- Communication Service: Manages customer notifications.
If you’re interested in a more detailed exploration of microservices, including the e-commerce example discussed here, be sure to check out our blog on microservices architecture. It offers in-depth insights and practical examples to help you understand how to design and manage complex systems effectively. Read more about microservices here.
Scenario: Users Can’t Complete Their Orders
Imagine that users are encountering issues with completing orders. Here’s how the ELK Stack can assist in troubleshooting this problem:

Log Collection with Logstash: Each microservice generates logs with the
.logextension. Logstash collects these logs, including those from the Order Management Service, which might contain error messages or transaction details. Logstash is configured to ingest these logs, parse and enrich them, and then forward them to Elasticsearch.Log Storage and Indexing in Elasticsearch: After Logstash processes the logs, they are sent to Elasticsearch. Here, the logs are indexed and stored, allowing for efficient searching and querying. For example, if you need to find error messages related to order processing, Elasticsearch can quickly retrieve the relevant logs.
Visualization and Analysis with Kibana: Using Kibana, you can create dashboards to visualize the logs. For instance, you could set up a dashboard to monitor error rates, response times, and other critical metrics. Kibana helps you visualize trends and identify patterns, such as a spike in errors from the Order Management Service. By analyzing these visualizations, you can drill down into the logs to pinpoint and resolve the issue.
The ELK Stack is indispensable for modern applications due to several reasons:
- Centralized Logging: It consolidates logs from various sources into a single platform, simplifying log management and analysis.
- Real-Time Insights: The stack provides real-time search and analytics, enabling swift identification and resolution of issues.
- Scalability: Designed to scale horizontally, the ELK Stack can handle increasing data volumes, ensuring continued performance as your application grows.
- Flexibility: With its schema-free nature and extensive plugin support, the ELK Stack adapts to various logging needs and data sources.
The ELK Stack is a powerful suite of tools that streamlines log management and analysis. By utilizing Elasticsearch, Logstash, and Kibana, you can efficiently collect, index, and visualize log data, gaining valuable insights into your applications. Whether you’re troubleshooting issues or monitoring performance, the ELK Stack provides the necessary tools to keep your systems running smoothly.
For more detailed information on each component of the ELK Stack, check out these resources:
- Elasticsearch Official Documentation – Comprehensive guide to Elasticsearch.
- Logstash Official Documentation – Detailed documentation on Logstash configuration and usage.
- Kibana Official Documentation – Guide to Kibana’s features and visualizations.
Additionally, explore our blog for more insights on modern application architecture and log management:
If you have any questions or need further assistance, feel free to reach out or leave a comment below. Don’t forget to subscribe to CodeOps Trek for more in-depth guides and tech insights!
